NIGHT FLIGHT
📡 Chapter 4
Reading the Radar
— Finding Invisible Capital Through Changes in the Numbers —
But the traces it leaves behind remain in the numbers.
Price, volume, Vol_ratio, VWAP, and the spread of movement across related stocks.
In Chapter 4, we treat them as a “radar” for observing the market.
Introduction | Radar Does Not Give You the Answer
In Chapter 3, we looked at how money moves from one part of the market to another. But market capital does not appear on a screen saying, “I am heading into bank stocks now.”
Even so, the movement of capital leaves traces: price, volume, VWAP, changes in price action, and the spread of movement into related stocks and sectors.
It tells us where to look more closely.
We will not begin with technical terms. We begin with a simpler question: “Why do we need to look at this number?”
01 | Is One Million Shares a Lot?
Suppose the screen shows trading volume of 1,000,000 shares. Is one million a lot?
We cannot tell from that number alone. If a stock normally trades only 100,000 shares, one million is a major change. If it normally trades 10 million shares, one million may actually be small.
✈️ Think of an airport
If a small airport normally handles 10 aircraft and suddenly 100 arrive today, you immediately feel that something is different. But at a huge airport that normally handles 1,000 aircraft, 100 would seem quiet.
The first question is: “How does today compare with usual?”
02 | Volume — The Number of Aircraft
In NIGHT FLIGHT, we think of trading volume as the number of aircraft in the sky.
When volume rises above normal, the radar goes “ping.” But we still do not say, “Buy!” More aircraft are visible, but we do not yet know where they are heading.
“Is buying activity becoming stronger?”
“Is heavy selling appearing?”
At this stage, both are still hypotheses.
03 | How Many Times the Usual Volume?
Suppose that by the same time of day, normal volume is 1 million shares and today it is 1.5 million.
Today is trading at 1.5 times the usual volume.
In NIGHT FLIGHT, we observe this “how many times normal?” relationship as Vol_ratio (relative volume).
Vol_ratio = “How many times the usual volume are we seeing today?”
04 | Vol_ratio — Is Today’s Sky Different?
| Vol_ratio | How to read it |
|---|---|
| 1.0 | About the usual level |
| 1.2 | 1.2 times usual |
| 1.5 | 1.5 times usual |
| 2.0 | Twice the usual level |
Vol_ratio 1.5 does not mean the stock will rise. It is not a buy signal. It is an alert that says, “Something is different. Look more closely.”
05 | VWAP — Today’s Reference Altitude
The radar has detected something. Next we want to know where the aircraft is flying. This is where VWAP enters the picture.
In NIGHT FLIGHT, we think of it as “today’s reference altitude.”
If price stays above VWAP, it is flying above the reference altitude. If it repeatedly falls below VWAP, it may be struggling to maintain altitude.
If price falls toward VWAP, rebounds there, and rises again, a new question appears: “Are market participants paying attention to the VWAP area?”
06 | One Aircraft — or a Formation?
Suppose semiconductor Stock A rises sharply and volume surges. By itself, that may be company-specific news.
But then Stock B rises, Stock C shows higher volume, and the semiconductor index also moves up. Now the radar is no longer showing one aircraft. It is showing a formation.
POINT → LINE → AREA
A change in one stock spreads to related stocks and then across a sector. Now the Chapter 3 hypothesis — “Could capital be moving into this sector?” — can be examined with the Chapter 4 radar.
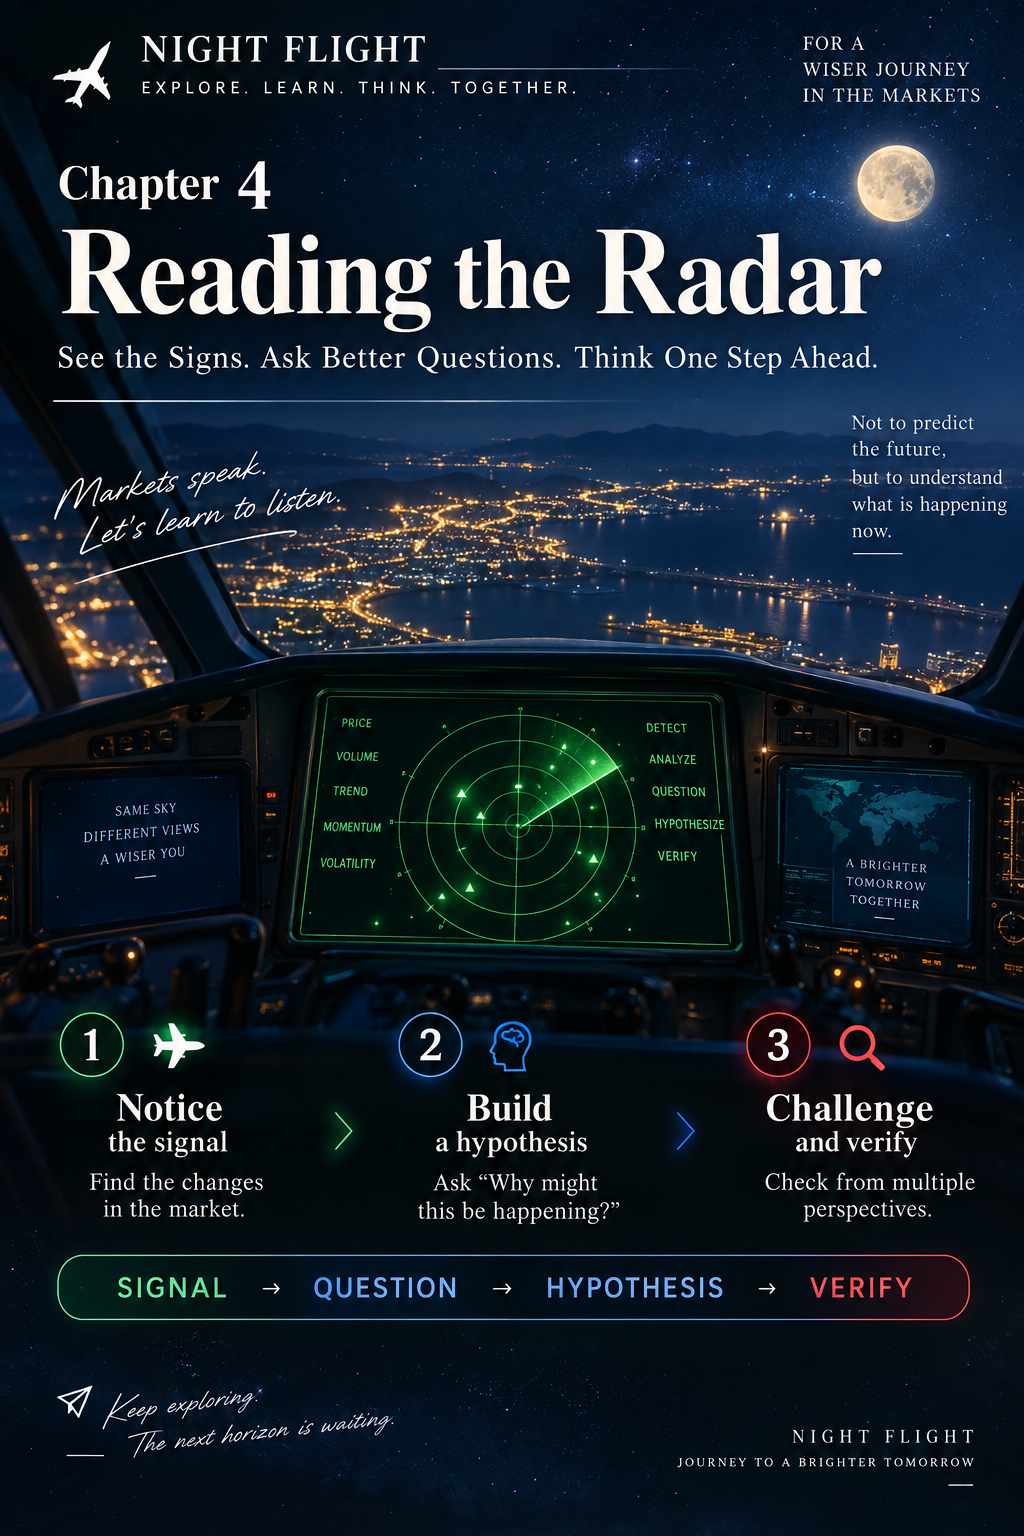
07 | Basic Radar Operation
We have looked at volume, Vol_ratio, VWAP, and the spread of movement across related stocks. The important point is not to decide the answer from a single number.
Even if Vol_ratio rises above 1.5, we do not jump to “Volume is up, so buy.” NIGHT FLIGHT moves through four stages after the radar detects a change.
SIGNAL | “Something is different.”
Volume suddenly increases. Vol_ratio rises. Price moves above VWAP. Related stocks begin to move. The radar has detected a change — but we do not decide the answer yet.
QUESTION | “Why?”
Why did volume increase? Is this stock moving alone? Are stocks in the same industry moving too? An unusual observation becomes a question.
HYPOTHESIS | “Could this be what is happening?”
A hypothesis is not an answer.
VERIFY | “Is that really true?”
Check VWAP, related stocks, the sector as a whole, and whether the movement continues as time passes. Test the signal with other evidence.
🟢 Beginner | Notice the signal
SIGNAL → QUESTION
Do not decide the answer immediately. First say, “Hmm?” Then ask, “Why?” That is already the work of a radar operator.
🔵 Intermediate | Build a hypothesis
SIGNAL → QUESTION → HYPOTHESIS
Vol_ratio 1.7, price above VWAP, and Stocks B and C rising: “Could capital be moving into this sector?”
🔴 Advanced | Challenge your own hypothesis
SIGNAL → QUESTION → HYPOTHESIS → VERIFY
Recheck at 9:30, 10:30, and 14:00. If the movement does not persist, be willing to say, “My first hypothesis may have been wrong.”
It means being able to challenge your own hypothesis.
Radar now becomes a method of observation: notice what is happening, ask why, form a hypothesis, and test it.
Become the Radar Operator
Stock A normally trades about 1 million shares by 10:00 a.m. Today, volume has already reached 1.5 million shares by 10:00 a.m.
Do not decide the trade yet. First ask why today is different.
Today’s 1.5 million versus the usual 1 million gives a Vol_ratio of 1.5. From there, widen the radar to price, VWAP, and related stocks.
✈️ Chapter 5 | Altitude and Speed
Something has appeared on the radar. Volume is rising, Vol_ratio is high, price is above VWAP, and related stocks are moving too.
But is the aircraft really climbing strongly — or is it already beginning to lose momentum?
price, rate of change, and momentum.
Momentum simply means the strength of the price movement. Begin with one question: “Does this stock have momentum right now?”
Next: Chapter 5 | Altitude and Speed — Price, Rate of Change, and Momentum